
Waterloo is a special place for tech. Our ecosystem’s tech credentials – especially in talent, business costs and research productivity – place us among North America’s most dynamic hubs and we can prove it.
According to CBRE, we’re the top emerging tech talent market in North America and home to Canada’s highest-quality tech talent. According to Deloitte, the fastest-growing tech companies in Canada are right here in Waterloo.
Nothing speaks as clearly as cold hard data. We recently published data-driven comparisons between Waterloo and emerging US tech markets like Austin, Pittsburgh, Columbus, Salt Lake City, Detroit and Phoenix. The results? Waterloo won each match-up.
Since that series started, we’ve dug up more new data that makes apples-to-apples comparisons with Europe’s top tech hubs possible. We’ll go head-to-head with new “5 Charts” articles about Berlin, Stockholm, London, Amsterdam and Munich.
How will Waterloo hold up against competition from Europe? We’ll see.
Match-up #3: Waterloo, Canada vs. London, UK
Quick Facts:
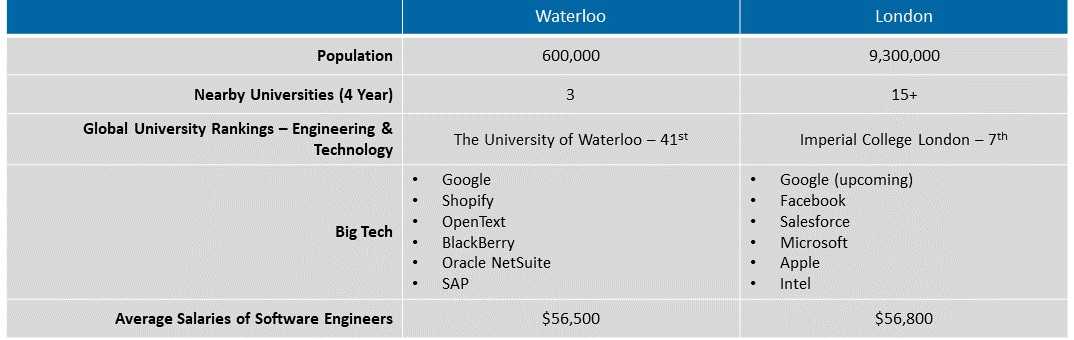
Despite the big difference in scale, Waterloo and London’s tech ecosystems have several features in common. Each city boasts world-class tech talent and a strong startup scene as well as excellent research capabilities. Who will take the tech crown?
Round One: Percentage of Population Employed in the ICT Sector

SOURCE: Eurostat, Waterloo EDC
Waterloo has an exceptionally high tech talent density. Home to Canada’s top technology university as well as one of Canada’s leading polytechnic institutes, it’s no surprise the region’s talent takes the lead. In fact, Waterloo has the highest tech talent density in North America.
While this standard measure doesn’t capture differences in scale, it does help illustrate how tech-focused the ecosystem is. Waterloo has fewer tech workers overall – though our proximity to Toronto helps with scale – but you’ll find most of this workforce in an extremely concentrated area. Waterloo’s international renown is as a tech hub for a reason.
Round Two: Startups per 100,000 People

SOURCES: Startup Genome, Nexten.io, and Conway calculations
A standard measure of tech density, startups per capita shows the nature of a region’s entrepreneurial ecosystem. Waterloo, Canada’s most innovative community, has the second-most startups per capita in North America.
Waterloo’s success comes from a support network of incubators and business resources as well as the University of Waterloo (UWaterloo), which produces 18% of the country’s tech founders.
Round Three: Patents per 100,000 People

SOURCE: European Patent Office (EPO)
This standard measure helps convey a region’s research capacity. With 150 patents registered per 100,000 people, Waterloo is the most patent-intensive community in Canada, at 11 times the national average.
Waterloo’s research and development abilities rival those of some of the world’s largest tech hubs. The region’s exceptional tech talent and network of top research centres contribute to Waterloo’s R&D advantage.
Round Four: Tech Program Sizes
.jpg)
SOURCES: University of Waterloo and Imperial College London
UWaterloo is Canada’s top technology school and is ranked among the top 50 technology schools worldwide. We chose to compare UWaterloo to Imperial College London, which is ranked #7 globally for engineering and technology.
Waterloo really excels in this comparison. In addition to being the country’s top technology school, UWaterloo is home to Canada’s largest engineering program, with tech-related enrollment above universities like Stanford, Massachusetts Institute of Technology (MIT) and Caltech. So, while our ranking is a bit lower (#41), our total output is incredible, ensuring that growing companies always have access to world-class talent.
UWaterloo also has the world’s largest co-op program, meaning students graduate with 2+ years of industry experience and career preparation.
Round Five: Rent Costs

SOURCE: Cushman & Wakefield (2016)
When it comes to rent costs, there’s no real comparison. Waterloo is way ahead of other tech hubs when it comes to the cost of doing business. This comes without sacrificing access to some of the world’s largest tech and consumer hubs. Located in the Toronto-Waterloo Tech Corridor, Waterloo has easy access to five US border crossings and 150 million consumers within a day’s drive.
Stay tuned for our next match-up with Amsterdam! As per usual, we will continue to use the same measures for each comparison – we don’t need to cherry-pick numbers to compete.